Linear Algebra Review
Linear Algebra forms the backbone of many machine learning algorithms, including linear regression. Understanding matrices and vectors is fundamental in this context.
Matrices Overview
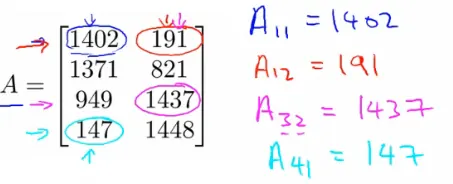
- Definition: Matrices are rectangular arrays of numbers enclosed in square brackets. They are the cornerstone of organizing and manipulating large sets of data.
- Notation: Typically denoted by uppercase letters (e.g., A, B, X, Y).
- Dimensions: Expressed as [Rows x Columns]. The entry in the $i^{th}$ row and $j^{th}$ column of a matrix A is denoted as $A_{(i,j)}$.
Vectors Overview
- Definition: A vector is a special type of matrix with only one column (n x 1 matrix).
- Notation: Usually represented by lowercase letters. The $i^{th}$ element of vector $v$ is denoted as $v_i$.
- Usage: Vectors are used to represent data points or features in machine learning.
Vector Representation
A vector can be represented as:
$$ y = \begin{bmatrix} x_{1} \\ x_{2} \\ \vdots \\ x_{m} \end{bmatrix} $$
where $x_{1}, x_{2}, ..., x_{m}$ are the elements of the vector.
Matrix Manipulation
Understanding matrix manipulation is essential in linear algebra and machine learning for organizing and processing data. Here are some fundamental operations:
Matrix Addition
Element-wise addition of two matrices of the same dimension.
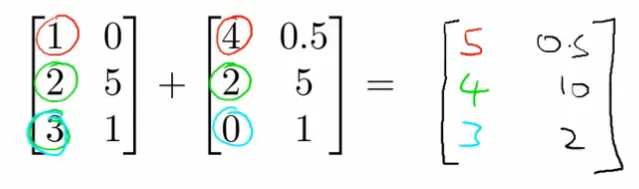
Important: The matrices must have the same number of rows and columns.
Multiplication by Scalar
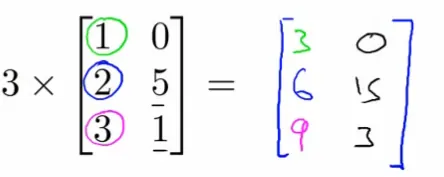
Multiplying every element of a matrix by a scalar value.
Multiplication by Vector
Multiplying a matrix with a vector.
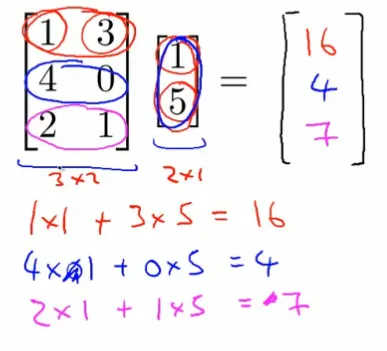
Important: The number of columns in the matrix must equal the number of elements in the vector.
Multiplication by Another Matrix
Combining two matrices.
Procedure:
- Multiply matrix A with each column vector of matrix B.
- This results in a new matrix where each column is the result of multiplying A with a column of B.
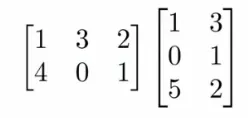
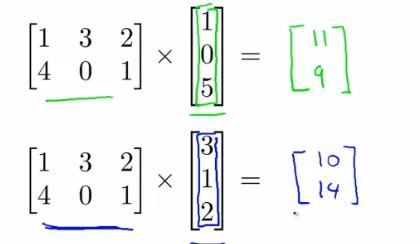
Important: The number of columns in the first matrix must match the number of rows in the second matrix.
Matrix Multiplication Properties
Matrix multiplication, a crucial operation in linear algebra, has specific properties that distinguish it from scalar multiplication.
Lack of Commutativity
I. For real numbers, multiplication is commutative.
$$3 \cdot 5 = 5 \cdot 3$$
II. The commutative property does not hold for matrix multiplication.
$$A \times B \neq B \times A$$
Associativity
I. Associative property holds for multiplication of real numbers.
$$3 \cdot (5 \cdot 2) = (3 \cdot 5) \cdot 2$$
II. Matrix multiplication is associative.
$$A \times (B \times C) = (A \times B) \times C$$
Identity Matrix
I. In scalar multiplication, 1 is the identity element.
$$z \cdot 1 = z$$
II. For matrices, the identity matrix $I$ serves as the identity element.
$$ I = \begin{bmatrix} 1 & 0 & 0 \\ 0 & 1 & 0 \\ 0 & 0 & 1 \end{bmatrix} $$
When multiplied by any compatible matrix $A$, it results in $A$ itself.
$$A \times I = A$$
Matrix Inverse
I. For non-zero real numbers, the multiplicative inverse holds.
$$x \cdot \frac{1}{x} = 1$$
II. Only square matrices can have an inverse. Not every square matrix has an inverse, analogous to how 0 has no multiplicative inverse in real numbers. Finding matrix inverses involves specific numerical methods.

Matrix Transpose
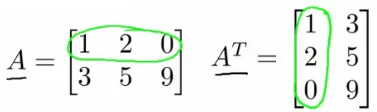
The transpose of a matrix $A$ of size $m \times n$ is another matrix $B$ of size $n \times m$, where the elements are flipped over its diagonal.
$B_{(j,i)} = A_{(i,j)}$.
Application in Machine Learning
- Data Representation: Matrices and vectors are used to represent datasets, where each row can be a data point and columns are the features.
- Model Representation: In linear regression, the hypothesis can be represented as a matrix-vector product, simplifying the computation and representation of multiple features.
- Efficiency: Linear algebra operations, especially when implemented in optimized libraries, provide efficient computation for large datasets.
Example: House Prices
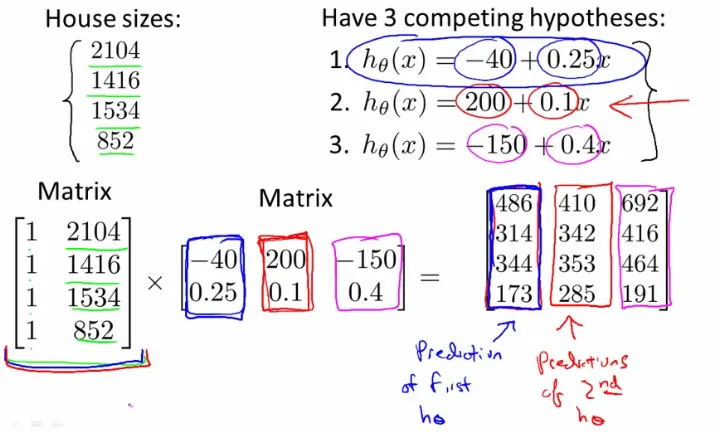
Suppose there are multiple hypotheses to predict house prices based on different factors. With a dataset of house sizes, these hypotheses can be applied simultaneously using matrix operations.
For four houses and three different hypotheses:
- Convert the data into a $4 \times 2$ matrix by adding an extra column of ones (to account for the bias term in linear regression).
- Multiply this matrix with a matrix containing the parameters of the hypotheses.
This approach demonstrates how matrix multiplication can streamline the application of multiple hypotheses to a dataset, enhancing efficiency and scalability.
Array Shapes Give the Operations Their Meaning
For m examples and n features, use a design matrix $X\in\mathbb R^{m\times n}$, a coefficient vector $\theta\in\mathbb R^n$, and target vector $y\in\mathbb R^m$. Matrix multiplication $X\theta$ produces one prediction per row. The gradient $X^\top(X\theta-y)$ returns one accumulated derivative per column.
In NumPy, the operator @ performs matrix multiplication; the operator * multiplies entries elementwise, with broadcasting where allowed. Neither operation checks whether the array represents the intended statistical object. Subtracting an array of shape $(m,1)$ from one of shape $(m,)$ broadcasts to $(m,m)$, creating pairwise differences rather than m residuals. Keeping both predictions and targets as one-dimensional arrays avoids that mistake in these examples.
An intercept is represented by a column of ones. Transposing swaps rows and columns but does not add or remove that column. For a one-dimensional NumPy array, transposition leaves its shape unchanged; an explicit column requires reshaping. These conventions explain why formulas written with column vectors need deliberate array shapes in code.
Worked Least Squares as an Orthogonal Projection
For the three-row matrix and target below, minimizing $\|X\theta-y\|^2$ gives $\theta=(2/3,1/2)$. The residual is $(-1/6,1/3,-1/6)$. Its inner product with the intercept column is zero, and its inner product with the feature column is also zero:
$$ -\frac16+\frac13-\frac16=0, \qquad -\frac16+2\left(\frac13\right)+3\left(-\frac16\right)=0. $$
This is the normal equation $X^\top(y-X\theta)=0$. The fitted vector is the projection of y onto the column space of X; the residual is perpendicular to that space. It describes a geometric condition on the optimum rather than a requirement to calculate an inverse.
import numpy as np
X = np.array([[1.0, 1.0], [1.0, 2.0], [1.0, 3.0]])
y = np.array([1.0, 2.0, 2.0])
theta, _, rank, _ = np.linalg.lstsq(X, y, rcond=None)
residual = y - X @ theta
np.testing.assert_allclose(X.T @ residual, 0.0, atol=1e-12)
assert X.shape == (3, 2) and (X @ theta).shape == (3,) and (rank == 2)
duplicated = np.column_stack([X, X[:, 1]])
minimum_norm, _, rank_dup, _ = np.linalg.lstsq(duplicated, y, rcond=None)
alternative = minimum_norm + np.array([0.0, 10.0, -10.0])
assert rank_dup == 2 < duplicated.shape[1]
np.testing.assert_allclose(duplicated @ minimum_norm, duplicated @ alternative)
np.testing.assert_allclose(duplicated @ minimum_norm, X @ theta)
np.testing.assert_allclose(minimum_norm, [2 / 3, 1 / 4, 1 / 4])
print('residual:', np.round(residual, 8))
print('rank:', rank_dup, 'minimum-norm coefficients:', np.round(minimum_norm, 8))
The duplicated-feature design has three columns but rank two. Its last two columns are identical. Adding any amount t to one slope and subtracting t from the other leaves every fitted value unchanged. NumPy's solver returns the minimum-Euclidean-norm solution, splitting the combined slope equally into $1/4$ and $1/4$.
The fitted predictions remain unique even when coefficients are not. Reporting one numerical parameter vector without checking rank can conceal this ambiguity. A redundant parameterization cannot become identifiable merely by collecting more exact copies of the same column relationship.
Solve a System without Explicitly Inverting It
An invertible square matrix A permits the notation $A^{-1}b$, but a numerical implementation usually solves $Ax=b$ directly. For an overdetermined regression, QR or SVD methods solve the least-squares problem without squaring the condition number by forming $X^\top X$.
Singular values measure how strongly X acts along different coefficient directions. A zero singular value identifies an exact null direction; a very small one signals a direction in which small data perturbations can produce large coefficient changes. The condition number compares the largest and smallest relevant singular values.
These facts distinguish algebraic existence from numerical stability. A nearly singular Gram matrix can be invertible in exact arithmetic and still be a poor computational route. Comparing residual orthogonality, fitted predictions, rank, and singular values supplies more evidence than checking only that an inversion returned numbers.
Reference
These notes are based on the free video lectures offered by Stanford University, led by Professor Andrew Ng. These lectures are part of the renowned Machine Learning course available on Coursera. For more information and to access the full course, visit the Coursera course page.