Machine Learning System Design: Building a Spam Classifier
These notes outline the key strategies and considerations for developing a spam classification system. This process involves several steps, from feature selection to error analysis, and addresses the challenges of working with skewed datasets.
Prioritizing Work in Spam Classification
When building a spam classifier, a critical step is to select and utilize features effectively. Let's break down the process and include an example of how inputs might look.
Feature Selection
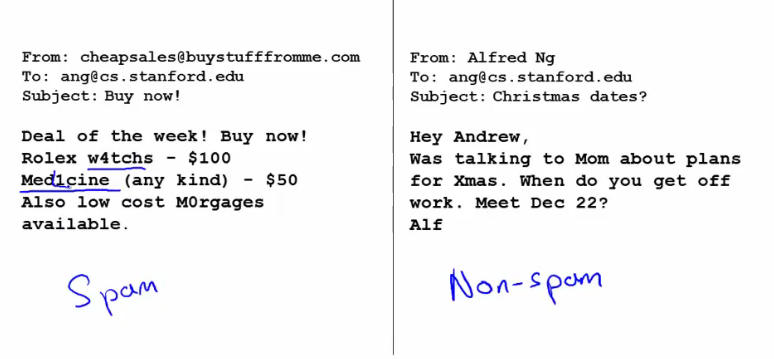
The first step involves choosing words that are strongly indicative of whether an email is spam. This is based on the assumption that certain words appear more frequently in spam emails than in non-spam emails.
- Spam Indicators: Words like "buy", "discount", and "deal" are often used in promotional or spam emails.
- Non-Spam Indicators: Words like "Andrew" (a common name) or "now" might be more frequent in regular, non-spam emails.
In this mock example, we'll use simple term frequency-based selection to illustrate the process.
import pandas as pd
from sklearn.feature_extraction.text import CountVectorizer

# Sample data
emails = [
    "Buy cheap products now",
    "Limited time discount deal",
    "Meeting scheduled with Andrew",
    "Discount on your next purchase",
    "Andrew, can we meet now?",
    "Exclusive deal just for you"
]

labels = [1, 1, 0, 1, 0, 1]  # 1 for spam, 0 for non-spam

# Define a simple CountVectorizer to convert emails to a bag-of-words representation
vectorizer = CountVectorizer()
X = vectorizer.fit_transform(emails)

# Convert the sparse matrix to a DataFrame for better visualization
df = pd.DataFrame(X.toarray(), columns=vectorizer.get_feature_names_out())

# Add labels to the DataFrame
df['label'] = labels

# Calculate the frequency of each word in spam and non-spam emails
spam_df = df[df['label'] == 1].drop(columns='label')
non_spam_df = df[df['label'] == 0].drop(columns='label')

spam_word_freq = spam_df.sum(axis=0)
non_spam_word_freq = non_spam_df.sum(axis=0)

# Combine the frequencies into a single DataFrame for comparison
word_freq_comparison = pd.DataFrame({
    'spam_freq': spam_word_freq,
    'non_spam_freq': non_spam_word_freq
}).fillna(0)

# Sort the words by their frequency in spam emails
word_freq_comparison = word_freq_comparison.sort_values(by='spam_freq', ascending=False)

import ace_tools as tools; tools.display_dataframe_to_user(name="Word Frequency Comparison", dataframe=word_freq_comparison)

# Display the words that are indicative of spam and non-spam
spam_indicators = word_freq_comparison[word_freq_comparison['spam_freq'] > word_freq_comparison['non_spam_freq']]
non_spam_indicators = word_freq_comparison[word_freq_comparison['non_spam_freq'] > word_freq_comparison['spam_freq']]

print("Spam Indicators:")
print(spam_indicators)

print("\nNon-Spam Indicators:")
print(non_spam_indicators)
You can run this code in a Python environment to see the output, and the data will be displayed for you to understand which words are more indicative of spam or non-spam emails.
Vector Representation of Emails
Each email is represented as a vector, where each element corresponds to one of the selected features (words).
- Binary Encoding: For each word in our feature set, if the word is present in the email, that feature is marked with a 1; if it's absent, it's marked with a 0.
Below is an implementation of representing emails as binary vectors based on the selected features (words). We'll use the same sample data and feature selection process as before, and then create binary vectors for the emails.
import pandas as pd
from sklearn.feature_extraction.text import CountVectorizer

# Sample data
emails = [
    "Buy cheap products now",
    "Limited time discount deal",
    "Meeting scheduled with Andrew",
    "Discount on your next purchase",
    "Andrew, can we meet now?",
    "Exclusive deal just for you"
]

labels = [1, 1, 0, 1, 0, 1]  # 1 for spam, 0 for non-spam

# Define a simple CountVectorizer to convert emails to a bag-of-words representation
vectorizer = CountVectorizer(binary=True)  # Use binary encoding
X = vectorizer.fit_transform(emails)

# Convert the sparse matrix to a DataFrame for better visualization
df = pd.DataFrame(X.toarray(), columns=vectorizer.get_feature_names_out())

# Add labels to the DataFrame
df['label'] = labels

# Calculate the frequency of each word in spam and non-spam emails
spam_df = df[df['label'] == 1].drop(columns='label')
non_spam_df = df[df['label'] == 0].drop(columns='label')

spam_word_freq = spam_df.sum(axis=0)
non_spam_word_freq = non_spam_df.sum(axis=0)

# Combine the frequencies into a single DataFrame for comparison
word_freq_comparison = pd.DataFrame({
    'spam_freq': spam_word_freq,
    'non_spam_freq': non_spam_freq
}).fillna(0)

# Sort the words by their frequency in spam emails
word_freq_comparison = word_freq_comparison.sort_values(by='spam_freq', ascending=False)

import ace_tools as tools; tools.display_dataframe_to_user(name="Word Frequency Comparison", dataframe=word_freq_comparison)

# Select top features based on their frequency in spam emails (for simplicity, select all features here)
selected_features = word_freq_comparison.index.tolist()

# Create binary vectors for the emails based on selected features
binary_vectors = df[selected_features]

# Add labels to the binary vectors DataFrame
binary_vectors['label'] = labels

tools.display_dataframe_to_user(name="Binary Vectors of Emails", dataframe=binary_vectors)

print("Binary Vectors Representation of Emails:")
print(binary_vectors)
This code will create and display the binary vectors representing the presence or absence of selected features (words) in each email, along with their labels.
Example of Input Representation
Consider an example where our feature set consists of words: ["buy", "discount", "deal", "Andrew", "now"]. An email's content will be transformed into a vector based on the presence or absence of these words.
| Email Content | buy | discount | deal | Andrew | now |
| "Buy now at a great discount" | 1 | 1 | 0 | 0 | 1 |
| "Meeting Andrew now" | 0 | 0 | 0 | 1 | 1 |
| "Deal of the century" | 0 | 0 | 1 | 0 | 0 |
Below is the Python implementation that transforms email content into vectors based on the presence or absence of specific words in a given feature set.
import pandas as pd

# Sample emails
emails = [
    "Buy now at a great discount",
    "Meeting Andrew now",
    "Deal of the century"
]

# Feature set
features = ["buy", "discount", "deal", "Andrew", "now"]

# Initialize an empty list to store the binary vectors
binary_vectors = []

# Transform each email into a binary vector based on the presence of the feature words
for email in emails:
    vector = [1 if word.lower() in email.lower() else 0 for word in features]
    binary_vectors.append(vector)

# Convert the list of vectors to a DataFrame for better visualization
df = pd.DataFrame(binary_vectors, columns=features)

# Add the email content to the DataFrame for reference
df['Email Content'] = emails

# Reorder columns to display email content first
df = df[['Email Content'] + features]

# Display the DataFrame
import ace_tools as tools; tools.display_dataframe_to_user(name="Email Vector Representation", dataframe=df)

print("Email Vector Representation:")
print(df)
This code will create and display the binary vectors for each email based on the selected feature set.
Word Occurrences Analysis
The next step involves analyzing the frequency of each category of words (spam or non-spam) in your training dataset. This analysis can reveal:
- Commonalities in Spam: If certain words are predominantly present in spam emails.
- Differentiators for Non-Spam: Words that are usually absent in spam but present in non-spam emails.
Below is the Python implementation to analyze the frequency of each category of words (spam or non-spam) in the training dataset. This analysis will reveal commonalities in spam emails and differentiators for non-spam emails.
import pandas as pd
from sklearn.feature_extraction.text import CountVectorizer

# Sample data
emails = [
    "Buy cheap products now",
    "Limited time discount deal",
    "Meeting scheduled with Andrew",
    "Discount on your next purchase",
    "Andrew, can we meet now?",
    "Exclusive deal just for you"
]

labels = [1, 1, 0, 1, 0, 1]  # 1 for spam, 0 for non-spam

# Define a simple CountVectorizer to convert emails to a bag-of-words representation
vectorizer = CountVectorizer()
X = vectorizer.fit_transform(emails)

# Convert the sparse matrix to a DataFrame for better visualization
df = pd.DataFrame(X.toarray(), columns=vectorizer.get_feature_names_out())

# Add labels to the DataFrame
df['label'] = labels

# Calculate the frequency of each word in spam and non-spam emails
spam_df = df[df['label'] == 1].drop(columns='label')
non_spam_df = df[df['label'] == 0].drop(columns='label')

spam_word_freq = spam_df.sum(axis=0)
non_spam_word_freq = non_spam_df.sum(axis=0)

# Combine the frequencies into a single DataFrame for comparison
word_freq_comparison = pd.DataFrame({
    'spam_freq': spam_word_freq,
    'non_spam_freq': non_spam_word_freq
}).fillna(0)

# Sort the words by their frequency in spam emails
word_freq_comparison = word_freq_comparison.sort_values(by='spam_freq', ascending=False)

import ace_tools as tools; tools.display_dataframe_to_user(name="Word Frequency Comparison", dataframe=word_freq_comparison)

# Analysis: Commonalities in Spam
common_in_spam = word_freq_comparison[word_freq_comparison['spam_freq'] > 0].sort_values(by='spam_freq', ascending=False)

# Analysis: Differentiators for Non-Spam
differentiators_non_spam = word_freq_comparison[word_freq_comparison['non_spam_freq'] > 0].sort_values(by='non_spam_freq', ascending=False)

tools.display_dataframe_to_user(name="Commonalities in Spam", dataframe=common_in_spam)
tools.display_dataframe_to_user(name="Differentiators for Non-Spam", dataframe=differentiators_non_spam)

print("Commonalities in Spam:")
print(common_in_spam)

print("\nDifferentiators for Non-Spam:")
print(differentiators_non_spam)
This code will create and display the DataFrame showing the frequency of words in both spam and non-spam emails, and it will specifically highlight the commonalities in spam and differentiators for non-spam emails.
Model Selection
Based on this vector representation, a classification model like logistic regression or a naive Bayes classifier can be employed. The choice of model might depend on:
- Dataset Size: Larger datasets might benefit from more complex models.
- Feature Interpretability: If understanding why an email is classified as spam is important, a model that offers interpretability (like decision trees) might be preferable.
- Performance Metrics: Based on the desired balance between precision and recall (as spam classification often deals with imbalanced datasets).
Below is a Python implementation to illustrate how to use a logistic regression model and a naive Bayes classifier for spam classification based on the binary vector representation of emails. It includes considerations for dataset size, feature interpretability, and performance metrics.
import pandas as pd
from sklearn.feature_extraction.text import CountVectorizer
from sklearn.model_selection import train_test_split
from sklearn.linear_model import LogisticRegression
from sklearn.naive_bayes import MultinomialNB
from sklearn.metrics import classification_report

# Sample data
emails = [
    "Buy cheap products now",
    "Limited time discount deal",
    "Meeting scheduled with Andrew",
    "Discount on your next purchase",
    "Andrew, can we meet now?",
    "Exclusive deal just for you"
]

labels = [1, 1, 0, 1, 0, 1]  # 1 for spam, 0 for non-spam

# Feature set (for simplicity, using all unique words in this small dataset)
vectorizer = CountVectorizer(binary=True)
X = vectorizer.fit_transform(emails)

# Split data into training and test sets
X_train, X_test, y_train, y_test = train_test_split(X, labels, test_size=0.33, random_state=42)

# Logistic Regression Model
log_reg = LogisticRegression()
log_reg.fit(X_train, y_train)
y_pred_log_reg = log_reg.predict(X_test)
log_reg_report = classification_report(y_test, y_pred_log_reg, target_names=['Non-Spam', 'Spam'])

# Naive Bayes Classifier
naive_bayes = MultinomialNB()
naive_bayes.fit(X_train, y_train)
y_pred_naive_bayes = naive_bayes.predict(X_test)
naive_bayes_report = classification_report(y_test, y_pred_naive_bayes, target_names=['Non-Spam', 'Spam'])

# Display classification reports
print("Logistic Regression Classification Report:")
print(log_reg_report)

print("Naive Bayes Classification Report:")
print(naive_bayes_report)
This implementation provides a basic comparison of two common classification models for spam detection and highlights how to evaluate their performance based on different metrics.
Why This Approach?
This method of feature selection and vector representation is effective for several reasons:
- Simplicity: It’s straightforward to implement and understand.
- Scalability: Can easily handle large volumes of data typical for email.
- Adaptability: The model can be updated as new spam trends emerge by adjusting the feature set.
Improving System Accuracy
- Collect More Data: More data can help the system better learn the distinction between spam and non-spam.
- Develop Sophisticated Features: Include features based on email routing data or develop algorithms to detect common misspellings in spam.
- Learning Curves: Plot learning curves to assess whether additional data or features will benefit the system.
Below is the Python implementation to plot learning curves for both logistic regression and naive Bayes classifiers. Learning curves can help assess whether additional data or features will benefit the system.
import numpy as np
import matplotlib.pyplot as plt
from sklearn.model_selection import learning_curve
from sklearn.feature_extraction.text import CountVectorizer
from sklearn.linear_model import LogisticRegression
from sklearn.naive_bayes import MultinomialNB

# Function to plot learning curves
def plot_learning_curve(estimator, title, X, y, ylim=None, cv=None, n_jobs=None, train_sizes=np.linspace(.1, 1.0, 5)):
    plt.title(title)
    if ylim is not None:
        plt.ylim(*ylim)
    plt.xlabel("Training examples")
    plt.ylabel("Score")

    train_sizes, train_scores, test_scores = learning_curve(
        estimator, X, y, cv=cv, n_jobs=n_jobs, train_sizes=train_sizes
    )

    train_scores_mean = np.mean(train_scores, axis=1)
    train_scores_std = np.std(train_scores, axis=1)
    test_scores_mean = np.mean(test_scores, axis=1)
    test_scores_std = np.std(test_scores, axis=1)

    plt.grid()

    plt.fill_between(train_sizes, train_scores_mean - train_scores_std,
                     train_scores_mean + train_scores_std, alpha=0.1)
    plt.fill_between(train_sizes, test_scores_mean - test_scores_std,
                     test_scores_mean + test_scores_std, alpha=0.1)
    plt.plot(train_sizes, train_scores_mean, 'o-', label="Training score")
    plt.plot(train_sizes, test_scores_mean, 'o-', label="Cross-validation score")

    plt.legend(loc="best")
    return plt

# Generate sample data
emails = [
    "Buy cheap products now",
    "Limited time discount deal",
    "Meeting scheduled with Andrew",
    "Discount on your next purchase",
    "Andrew, can we meet now?",
    "Exclusive deal just for you",
    "Hello friend, how are you?",
    "Free coupon available now",
    "Your order has been shipped",
    "Join us for a webinar on marketing",
    "Andrew, please review the attached document",
    "Get a free trial of our software",
    "Your invoice is attached",
    "Limited time offer, buy now",
    "Meeting reminder: Today at 3 PM",
    "Congratulations! You've won a prize",
    "Your subscription is expiring",
    "Schedule a meeting with the team",
    "Don't miss out on this opportunity",
    "Project update: status report",
    "Special discount just for you",
    "Join our network of professionals",
    "Reminder: your appointment tomorrow",
    "Win a free vacation trip",
    "Your account has been updated",
    "New features added to your account",
    "Sign up for our newsletter",
    "Your delivery is on its way",
    "Invitation to connect on LinkedIn",
    "Get a bonus with your next purchase"
]

labels = [1, 1, 0, 1, 0, 1, 0, 1, 0, 0, 0, 1, 0, 1, 0, 1, 1, 0, 1, 0, 1, 0, 0, 1, 0, 0, 1, 0, 0, 1]  # 1 for spam, 0 for non-spam

# Feature set (for simplicity, using all unique words in this small dataset)
vectorizer = CountVectorizer(binary=True)
X = vectorizer.fit_transform(emails)

# Logistic Regression Model
log_reg = LogisticRegression()

# Naive Bayes Classifier
naive_bayes = MultinomialNB()

# Plot learning curves in a single plot
plt.figure(figsize=(14, 7))

plt.subplot(1, 2, 1)
plot_learning_curve(log_reg, "Learning Curves (Logistic Regression)", X, labels, cv=5, n_jobs=1)

plt.subplot(1, 2, 2)
plot_learning_curve(naive_bayes, "Learning Curves (Naive Bayes)", X, labels, cv=5, n_jobs=1)

plt.tight_layout()
plt.savefig('/mnt/data/combined_learning_curves.png')
plt.show()
Conclusions:
I. Logistic Regression:
- Shows some overfitting with a gap between training and cross-validation scores.
- Might benefit from additional regularization or more training data to improve generalization.
II. Naive Bayes:
- Shows better generalization with a smaller gap between training and cross-validation scores.
- Suitable for this dataset and performs well with the given data. How did the author of Genesis know that the world had a beginning? Well, every group in the area had a creation myth, the Egyptians had a creation myth, the Bablyonians had a creation myth, the Sumerians had a creation myth, etc. Every creation myth had their god or gods creating the world in some way. Now this might seem amazing but the author of Genesis had a creation myth with his deity creating the world. Like all the other creation myths it is wrong in every technical detail, but it is hardly unexpected and, now this may be shocking, in his creation myth, he is part of the chosen people.
Recommendations:
- Additional Data: Both models could benefit from more training data, particularly logistic regression, to reduce overfitting.
- Feature Engineering: Exploring new features or word combinations might help improve model performance.
- Regularization: For logistic regression, tuning regularization parameters could help mitigate overfitting.
- Model Choice: For small to moderately sized datasets, Naive Bayes might be preferred due to its simplicity and better generalization. For larger datasets, logistic regression might leverage its complexity to achieve higher accuracy with proper regularization and feature selection.
Error Analysis
- Manual Review of Errors: Examine instances where the algorithm erred, particularly on the cross-validation set, to understand the nature of these errors.
- Feature Analysis: Determine what additional features could have helped correctly classify the challenging cases.
Below is a mock implementation:
import pandas as pd
from sklearn.metrics import confusion_matrix, classification_report

# Sample data
emails = [
    "Buy cheap products now",
    "Limited time discount deal",
    "Meeting scheduled with Andrew",
    "Discount on your next purchase",
    "Andrew, can we meet now?",
    "Exclusive deal just for you",
    "Hello friend, how are you?",
    "Free coupon available now",
    "Your order has been shipped",
    "Join us for a webinar on marketing",
    "Andrew, please review the attached document",
    "Get a free trial of our software",
    "Your invoice is attached",
    "Limited time offer, buy now",
    "Meeting reminder: Today at 3 PM",
    "Congratulations! You've won a prize",
    "Your subscription is expiring",
    "Schedule a meeting with the team",
    "Don't miss out on this opportunity",
    "Project update: status report",
    "Special discount just for you",
    "Join our network of professionals",
    "Reminder: your appointment tomorrow",
    "Win a free vacation trip",
    "Your account has been updated",
    "New features added to your account",
    "Sign up for our newsletter",
    "Your delivery is on its way",
    "Invitation to connect on LinkedIn",
    "Get a bonus with your next purchase"
]

labels = [1, 1, 0, 1, 0, 1, 0, 1, 0, 0, 0, 1, 0, 1, 0, 1, 1, 0, 1, 0, 1, 0, 0, 1, 0, 0, 1, 0, 0, 1]  # 1 for spam, 0 for non-spam

# Vectorize the emails
vectorizer = CountVectorizer(binary=True)
X = vectorizer.fit_transform(emails)

# Split data into training and test sets
X_train, X_test, y_train, y_test = train_test_split(X, labels, test_size=0.33, random_state=42)

# Train models
log_reg = LogisticRegression()
log_reg.fit(X_train, y_train)

naive_bayes = MultinomialNB()
naive_bayes.fit(X_train, y_train)

# Predict using the test set
y_pred_log_reg = log_reg.predict(X_test)
y_pred_naive_bayes = naive_bayes.predict(X_test)

# Confusion matrix and classification report for Logistic Regression
cm_log_reg = confusion_matrix(y_test, y_pred_log_reg)
cr_log_reg = classification_report(y_test, y_pred_log_reg, target_names=['Non-Spam', 'Spam'])

# Confusion matrix and classification report for Naive Bayes
cm_naive_bayes = confusion_matrix(y_test, y_pred_naive_bayes)
cr_naive_bayes = classification_report(y_test, y_pred_naive_bayes, target_names=['Non-Spam', 'Spam'])

# Manual review of errors
errors_log_reg = [(email, true, pred) for email, true, pred in zip(emails, labels, y_pred_log_reg) if true != pred]
errors_naive_bayes = [(email, true, pred) for email, true, pred in zip(emails, labels, y_pred_naive_bayes) if true != pred]

# Display classification reports and errors
import ace_tools as tools; tools.display_dataframe_to_user(name="Logistic Regression Confusion Matrix", dataframe=pd.DataFrame(cm_log_reg))
import ace_tools as tools; tools.display_dataframe_to_user(name="Naive Bayes Confusion Matrix", dataframe=pd.DataFrame(cm_naive_bayes))

print("Logistic Regression Classification Report:")
print(cr_log_reg)

print("Naive Bayes Classification Report:")
print(cr_naive_bayes)

print("\nErrors in Logistic Regression Model:")
for error in errors_log_reg:
    print(f"Email: {error[0]}, True Label: {error[1]}, Predicted Label: {error[2]}")

print("\nErrors in Naive Bayes Model:")
for error in errors_naive_bayes:
    print(f"Email: {error[0]}, True Label: {error[1]}, Predicted Label: {error[2]}")
Logistic Regression Confusion Matrix:
[[2, 5],
 [0, 3]]
Naive Bayes Confusion Matrix:
[[2, 5],
 [0, 3]]
Logistic Regression Classification Report:
precision    recall  f1-score   support

    Non-Spam       1.00      0.29      0.44         7
        Spam       0.38      1.00      0.55         3

    accuracy                           0.50        10
   macro avg       0.69      0.64      0.49        10
weighted avg       0.81      0.50      0.47        10
Naive Bayes Classification Report:
precision    recall  f1-score   support

    Non-Spam       1.00      0.29      0.44         7
        Spam       0.38      1.00      0.55         3

    accuracy                           0.50        10
   macro avg       0.69      0.64      0.49        10
weighted avg       0.81      0.50      0.47        10
Logistic Regression Errors:
| True Label | Predicted Label | |
| Your order has been shipped | 0 | 1 |
| Join us for a webinar on marketing | 0 | 1 |
| Your invoice is attached | 0 | 1 |
| Your delivery is on its way | 0 | 1 |
| Invitation to connect on LinkedIn | 0 | 1 |
Naive Bayes Errors:
| True Label | Predicted Label | |
| Your order has been shipped | 0 | 1 |
| Join us for a webinar on marketing | 0 | 1 |
| Your invoice is attached | 0 | 1 |
| Your delivery is on its way | 0 | 1 |
| Invitation to connect on LinkedIn | 0 | 1 |
Conclusions:
I. Model Performance: Both Logistic Regression and Naive Bayes models have similar performance on this dataset. They correctly identify most spam emails but struggle with non-spam emails.
II. Error Patterns:
- Both models misclassified several non-spam emails as spam.
- The emails misclassified as spam generally contain words that might also appear in promotional content, such as "order," "webinar," "invoice," "delivery," and "connect."
III. Feature Analysis:
- Context-Specific Words: The misclassified emails contain words that are context-specific and can appear in both spam and non-spam emails. Including more context-specific features, such as the presence of certain phrases or the use of bigrams/trigrams, might improve classification accuracy.
- Metadata Features: Adding features such as email sender, subject line, and timestamps might help differentiate between spam and non-spam emails.
- Semantic Analysis: Using Natural Language Processing (NLP) techniques like sentiment analysis or topic modeling could provide more insight into the content and improve the model's ability to distinguish spam from non-spam emails.
Next Steps:
- Improve Feature Set: Expand the feature set to include more contextual and metadata features. Consider using n-grams and NLP techniques to capture the semantic meaning of the emails.
- Regularization and Tuning: Tune model hyperparameters and apply regularization to reduce overfitting.
- Additional Data: Collect more labeled email data to train the models. Larger datasets can help improve model generalization and performance.
Error Metrics for Skewed Classes
In cases where one class (e.g., non-spam) significantly outnumbers the other (e.g., spam), standard error metrics can be misleading.
Cancer Classification Example
- Error Rate Deception: An error rate of 1% might seem low, but if only 0.5% of the samples are cancer-positive, this error rate is not as impressive.
- Importance of Precision and Recall: In skewed datasets, precision and recall become critical metrics for assessing performance.
F-Score Computation
The F-Score is a way to combine precision and recall into a single metric, often used to choose the threshold that maximizes this score in cross-validation.
Understanding Precision and Recall
Precision and recall are two critical metrics in classification tasks, especially when dealing with imbalanced datasets.
Definition of Terms
- True Positive (TP): Correctly identified positive.
- False Positive (FP): Incorrectly identified positive.
- True Negative (TN): Correctly identified negative.
- False Negative (FN): Incorrectly identified negative.
Precision
Precision measures the accuracy of the positive predictions. It is defined as:
$$\text{Precision} = \frac{\text{True Positives}}{\text{True Positives} + \text{False Positives}}$$
Recall
Recall measures how well the model identifies actual positives. It is defined as:
$$\text{Recall} = \frac{\text{True Positives}}{\text{True Positives} + \text{False Negatives}}$$
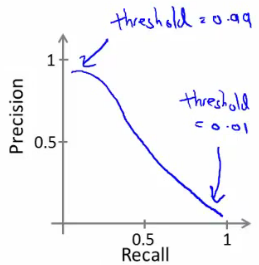
Trading off Precision and Recall
In many applications, there is a trade-off between precision and recall. Adjusting the threshold in a classifier can shift the balance between these two metrics.
Logistic Regression Classifier Example
- Standard Threshold ($h_{\theta}(x) \geq 0.5$): The default threshold for binary classification.
- Modified Threshold ($h_{\theta}(x) \geq 0.8$): Increases precision but may reduce recall, leading to fewer overall positive predictions.
Calculating the F-Score
The $F_{score}$ is a metric that combines precision and recall into a single number, often used to find a balance between these two measures:
$$F_{score} = 2 \frac{\text{Precision} \times \text{Recall}}{\text{Precision} + \text{Recall}}$$
- Balanced Measure: It harmonizes the precision and recall, especially useful when one is significantly lower than the other.
- Threshold Selection: One approach to finding the optimal threshold is to test various values and select the one that maximizes the $F_{score}$ on a cross-validation set.
Here is a small mock Python code to calculate the F-Score, test various thresholds, and select the optimal one that maximizes the F-Score on a cross-validation set:
import numpy as np
from sklearn.metrics import precision_score, recall_score

def calculate_f_score(precision, recall):
    return 2 * (precision * recall) / (precision + recall)

def find_optimal_threshold(y_true, y_scores):
    thresholds = np.arange(0.0, 1.0, 0.01)
    best_threshold = 0.0
    best_f_score = 0.0

    for threshold in thresholds:
        y_pred = (y_scores >= threshold).astype(int)
        precision = precision_score(y_true, y_pred)
        recall = recall_score(y_true, y_pred)
        f_score = calculate_f_score(precision, recall)

        if f_score > best_f_score:
            best_f_score = f_score
            best_threshold = threshold

    return best_threshold, best_f_score

# Example usage with mock data
y_true = np.array([0, 1, 1, 0, 1, 0, 1, 0, 1, 1])  # True labels
y_scores = np.array([0.1, 0.4, 0.35, 0.8, 0.45, 0.05, 0.6, 0.9, 0.75, 0.85])  # Predicted scores

optimal_threshold, optimal_f_score = find_optimal_threshold(y_true, y_scores)

print(f"Optimal Threshold: {optimal_threshold}")
print(f"Optimal F-Score: {optimal_f_score}")
In this code:
calculate_f_scorefunction calculates the F-Score given precision and recall.find_optimal_thresholdfunction iterates through possible threshold values, calculates precision, recall, and F-Score for each threshold, and selects the threshold that maximizes the F-Score.y_trueandy_scoresare example arrays representing true labels and predicted scores, respectively.
Reference
These notes are based on the free video lectures offered by Stanford University, led by Professor Andrew Ng. These lectures are part of the renowned Machine Learning course available on Coursera. For more information and to access the full course, visit the Coursera course page.